Gus Freeman is MD, Arabian Research Bureau
URL: www.arabianresearch.com
In one day your average person generates considerable amounts of data which are captured and stored somewhere -phone calls, purchases, bank transactions, documents written on a computer, car park tickets, ‘log ons’ to the Internet, clocking on at work, entrance to a shop monitored by CCTV, buying a ticket to Muscat Festival - to think of a few everyday examples.
Data in themselves are of less value. They are a collection of numbers stored on paper in Arabic numerals or magnetically in binary code. But when they are processed into information and presented to answer a question or inform a decision, then they become interesting and generate value for us. It is like a cake mix. In raw form, the powdery substance is tasteless. Add eggs, some milk and water, stir and bake for half an hour, and it becomes a tasty cake ready to serve.
The difference between data and information is that information assembles data in a particular way for a particular end. Information answers a question or informs a decision that has to be taken. Information is usually a summary or aggregation of lots of data.
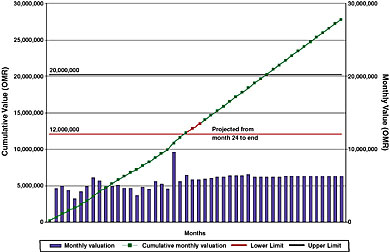
Take, for example, the management of expenditure on a contract. Diagram 1 shows actual expenditure 24 months in to a 48 month project and answers the questions mid way through, ‘Is the contract value likely to exceed an upper budget limit and if so when?’ The graph in Diagram 1 has assembled lots of data on expenditure and timing and then processed them into information to answer these two questions. It shows that at the present rate of expenditure the upper limit will be reached in 36 months.
Error! Not a valid link.
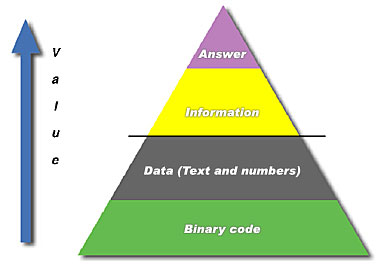
As data is transformed into information it generates more value. The Information Pyramid in Diagram 2 shows the lowest form of data on the bottom layer as binary code. The second layer is the one we are more familiar with consisting of data we can see in the form of text and numbers. The line in the Information Pyramid diagram, binary code and data are of little direct value in themselves. As we move above the line, data are transformed into information which in turn can answer a question or form input for a decision to be made. The data then start generating greater value.
To apply these observations to your organisation, you have access to many data generated internally by your own operations or available to you outside. You will create value from these data for your organisation by asking questions, any type of question. For example at a policy level:
» How much are Gulf nationals willing to pay for quality higher education?
» What should a programme promoting good practices of child treatment focus on to be effective?
» Which tourist types should be targeted for marketing to maximise revenues to Oman?
» What will a change in the property ownership law do to the demand for housing loans?
Other questions in businesses large, medium or small might be:
» What annual turnover could we realistically put in our 3 year business plan?
» Which market prospects should we target in our marketing strategy?
» What price should be charged for these products to maximise profit?
» What niches are there in our market for new products or services?
Take time sheeting, for example. Organisations may get employees or contract workers to account for time they spend on a job for the purpose of paying them or accounting for what they pay them. Over a period of time with several staff, this administrative procedure generates and stores (if you keep them), on paper or digitally, large amounts of data. These data are lying around redundant, having fulfilled their original purpose to account for workers’ time.
Value can be created from these time sheet data by asking questions of them such as:
» Have we got quicker at performing tasks over time?
» Which staff member has the highest productivity?
» Which staff should be allocated to this task in the future?
The time sheet data could be analysed to produce answers to these questions, thus generating value for your organisation.
Again, basic point of sales data at a retail outlet such as a video store, restaurant or shop records the time of day purchases are made. These data could be turned into value adding information telling you which opening hours will maximise your profit.
We need to ask more questions to get value from the data lying around us. Whether it will be economically or commercially worthwhile going through the research and analysis process to answer the question will depend on the cost benefit equation. What is the value of having this question answered and what is the cost of answering it?
Estimating the benefit of having a question answered can be quite difficult. What is the value of correctly identifying that a 25% price reduction will lead to a 100% increase in sales? In other cases, such as optimising openings for maximising profit, the value could be plainly calculated.
One organisation in Oman went through a research process in 2004 that involved analysis of their own customer data and interviews with old customers that no longer use them. One manager testified an outcome of the research was their management team now shared a common view of their customer base which meant they were making decisions quickly with more unity than before. How do you estimate that?
Another organisation in Oman found out one important segment of their market in which they had a lower market share than other segments, had different requirements from the other segments and needed serving in a different way. They have employed someone in 2004 on the basis of this finding to provide that service. In both cases, whilst it is difficult to put a figure on the value generated by having those questions answered, the organisations saw significant value was generated.
On the cost side, technology is making it easier and quicker to collect, store and analyse data and present information to end users. Scanners and bar code machines can convert written data into digital form for processing more easily than having someone sit and perform data entry. Advances in spreadsheet and analytical softwares for processing data are making it quicker to do the analysis. Hand held computers (PDAs) are reducing the time and money required to generate new data. Mobile phone SMS and Internet can be used to launch certain questionnaire surveys to get feedback from customers. The Web can be used to present and disseminate research findings sharing the answers to questions more quickly and more widely. In future this Research and ICT column of Digital Oman will bring examples of how some of these technologies are being used to make the research process easier.
The cost benefit equation needs to be applied which will mean that not all questions will get answered. But if use is going to be made of the growing oceans of data that are available to us and information created to add value to our organisations, we need to be asking more questions.